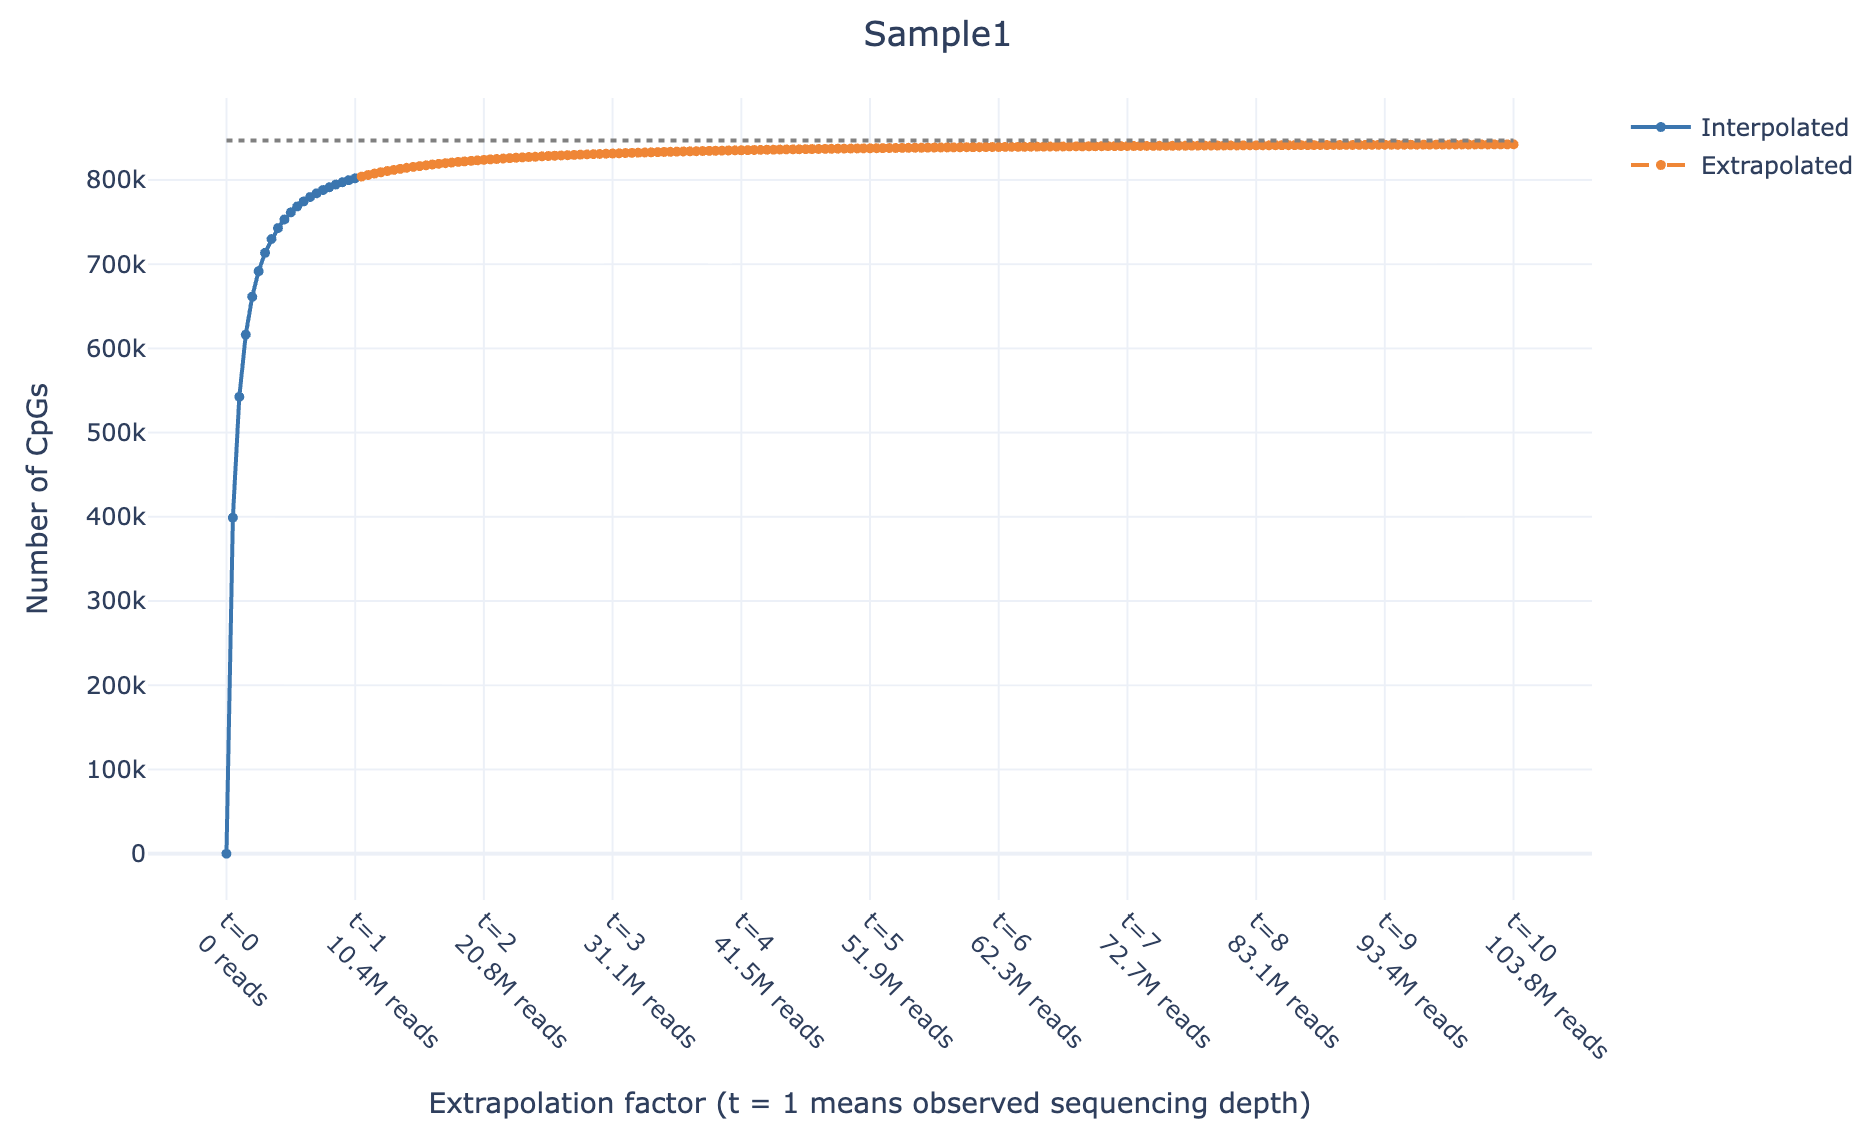
Example Workflow
Using Chao Estimator (Recommended)
# Run Chao estimator on BAM file
methurator gt-estimator --genome hg19 my_sample.bam --config_ci

# Generate plots from the results
methurator plot --summary output/methurator_summary.yml
Example plot preview (also available as interactive html file here):
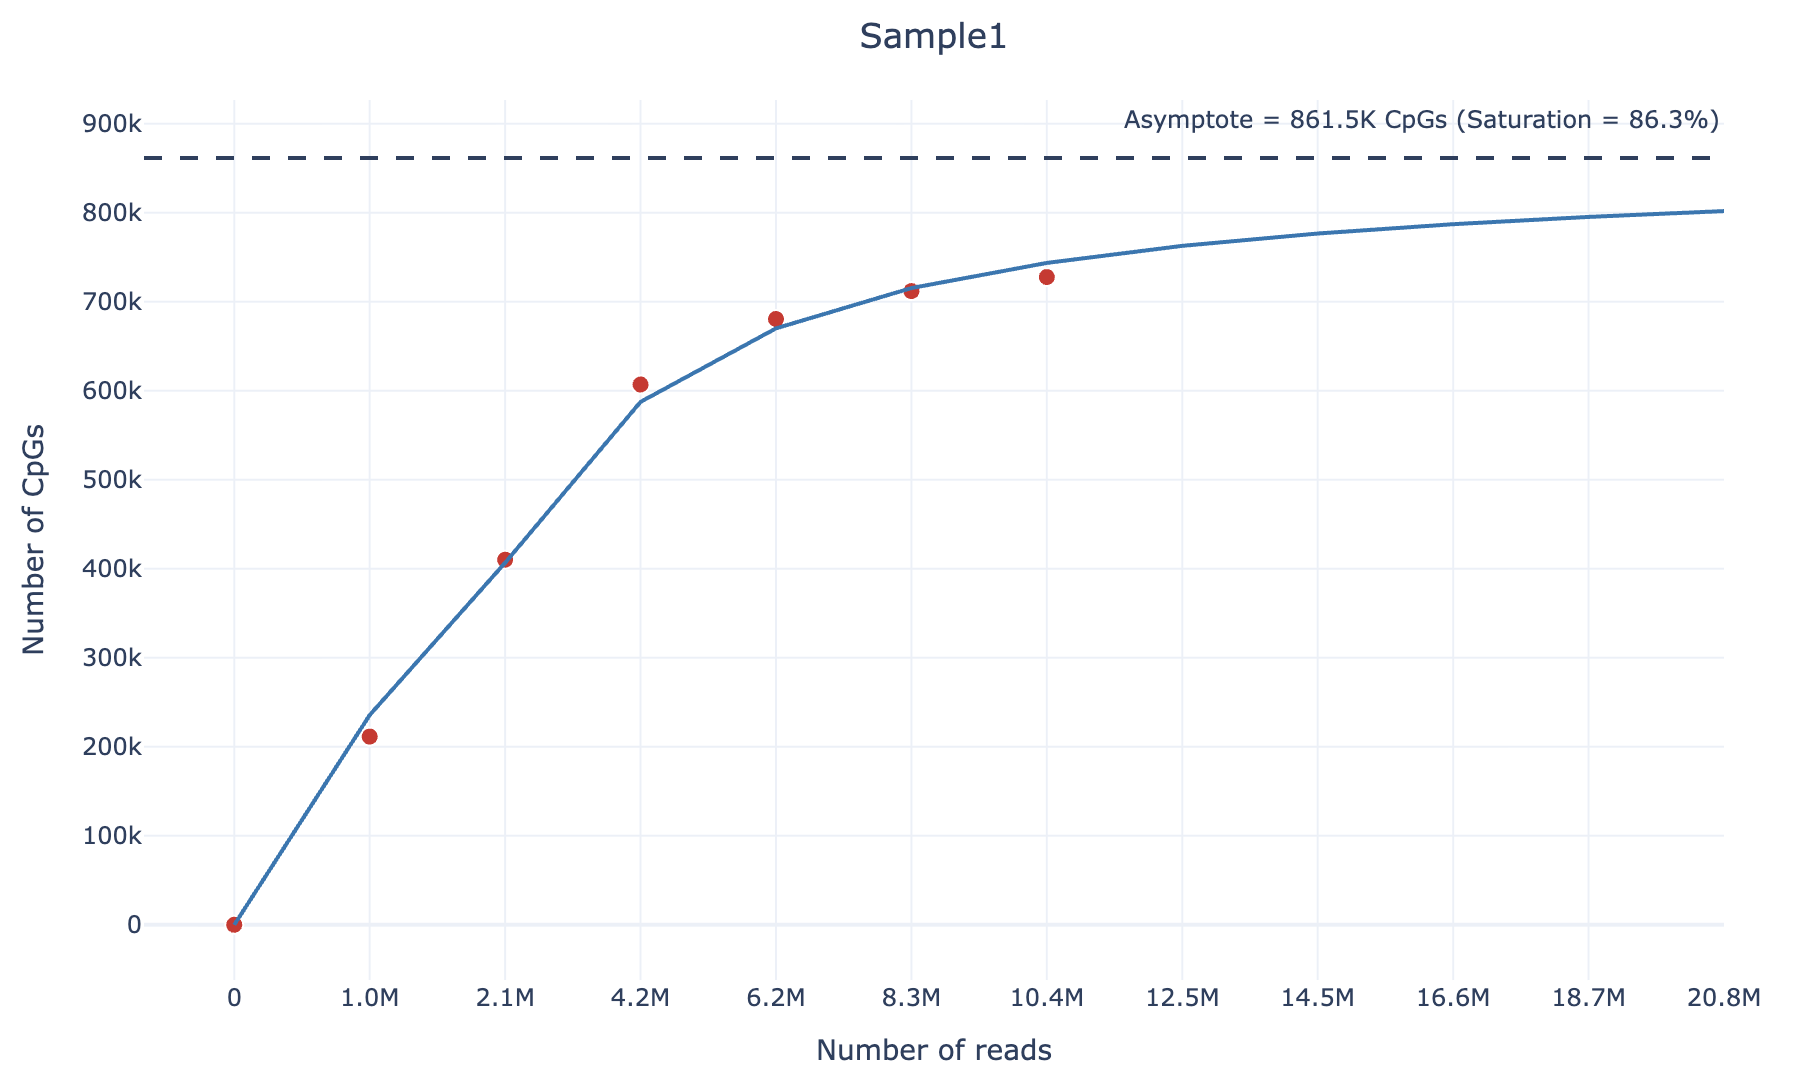
Using Downsample
# Downsample BAM file
methurator downsample --genome hg19 my_sample.bam

# Generate plots from the results
methurator plot --summary output/methurator_summary.yml
The output plots will be saved in output/plots/ as interactive HTML files showing the CpG predictions, the asymptote (theoretical maximum CpGs at t = 1000), the number of reads at each t, and confidence intervals (if enabled). The asymptote is now also used to compute the saturation values.
Example plot preview (also available as interactive html file here):