🧬 methurator
![]()
![]()
![]()
![]()
![]()
Methurator is a Python package designed to estimate sequencing saturation for reduced-representation bisulfite sequencing (RRBS) data.
Although optimized for RRBS, methurator can also be used for whole-genome bisulfite sequencing (WGBS) or other genome-wide methylation data (e.g. EMseq). However, this data we advise you to use Preseq package.
📑 Table of Contents
- 1. Dependencies and Notes
- 2. Installation
- 3. Quick Start
- 4. Command Reference
- 5. Example Workflow
- 6. How do we compute the sequencing saturation?
1. Dependencies and Notes
- methurator uses SAMtools and MethylDackel internally for BAM subsampling, thus they need to be installed.
- When
--genomeis provided, the corresponding FASTA file will be automatically fetched and cached. - Temporary intermediate files are deleted by default unless
--keep-temporary-filesis specified.
2. Installation
You can install methurator in several ways:
Option 1: Install via pip
pip install methurator
Option 2: Install via BioConda
conda create -n methurator_env bioconda::methurator
conda activate methurator_env
Option 3: Use the BioContainer
docker pull quay.io/biocontainers/methurator:0.1.8--pyhdfd78af_0
docker run quay.io/biocontainers/methurator:0.1.8--pyhdfd78af_0 methurator -h
3. Quick Start
Step 1 — Downsample BAM files
The downsample command performs BAM downsampling according to the specified percentages and coverage.
methurator downsample --fasta tests/data/genome.fa tests/data/Ecoli.csorted.bam
This command generates three summary files:
- CpG summary — number of unique CpGs detected in each downsampled BAM
- Reads summary — number of reads in each downsampled BAM
- Summary yml - a YAML file which contains all data above in a single file. It also contains run metadata for the sake of reproducibility.
Example outputs can be found in tests/data.
Step 2 — Plot the sequencing saturation curve
Use the plot command to visualize sequencing saturation:
methurator plot --summary tests/data/methurator_summary.yml
4. Command Reference
downsample command
| Argument | Description | Default |
|---|---|---|
BAM (positional) |
Path to a single .bam file or to multiple ones (e.g. files/*.bam). |
— |
--outdir, -o |
Output directory. | ./output |
--fasta |
Path to the reference genome FASTA file. If not provided, it will be automatically downloaded based on --genome. |
— |
--genome |
Genome used for alignment. Available: hg19, hg38, GRCh37, GRCh38, mm10, mm39. |
— |
--downsampling-percentages, -ds |
Comma-separated list of downsampling percentages between 0 and 1 (exclusive). | 0.1,0.2,0.4,0.6,0.8 |
--minimum-coverage, -mc |
Minimum CpG coverage to consider for saturation. Can be a single integer or a list (e.g. 1,3,5). |
3 |
--rrbs |
If set to True, MethylDackel extract will consider the RRBS nature of the data adding the –keepDupes flag. | True |
--threads, -@ |
Number of threads to use while downsampling | Number of available threads |
--keep-temporary-files |
If set, temporary files will be kept after analysis. | False |
--verbose |
Enable verbose logging. | False |
--help , -h |
Print the help message and exit. | |
--version |
Print the package version. |
plot command
| Argument | Description | Default |
|---|---|---|
--summary, -s |
Path to the YML summary file. | |
--outdir, -o |
Output directory. | ./output |
--verbose |
Enable verbose logging. | False |
--help , -h |
Print the help message and exit. | |
--version |
Print the package version. |
5. Example Workflow
# Step 1: Downsample BAM file
methurator downsample --genome hg19 my_sample.bam

# Step 2: Plot saturation curve
methurator plot --summary output/methurator_summary.yml
Finally, you will get (within the output/plots) directory an html file containing the sequencing saturation plot, similarly to the following example (also available as interactive html file here):
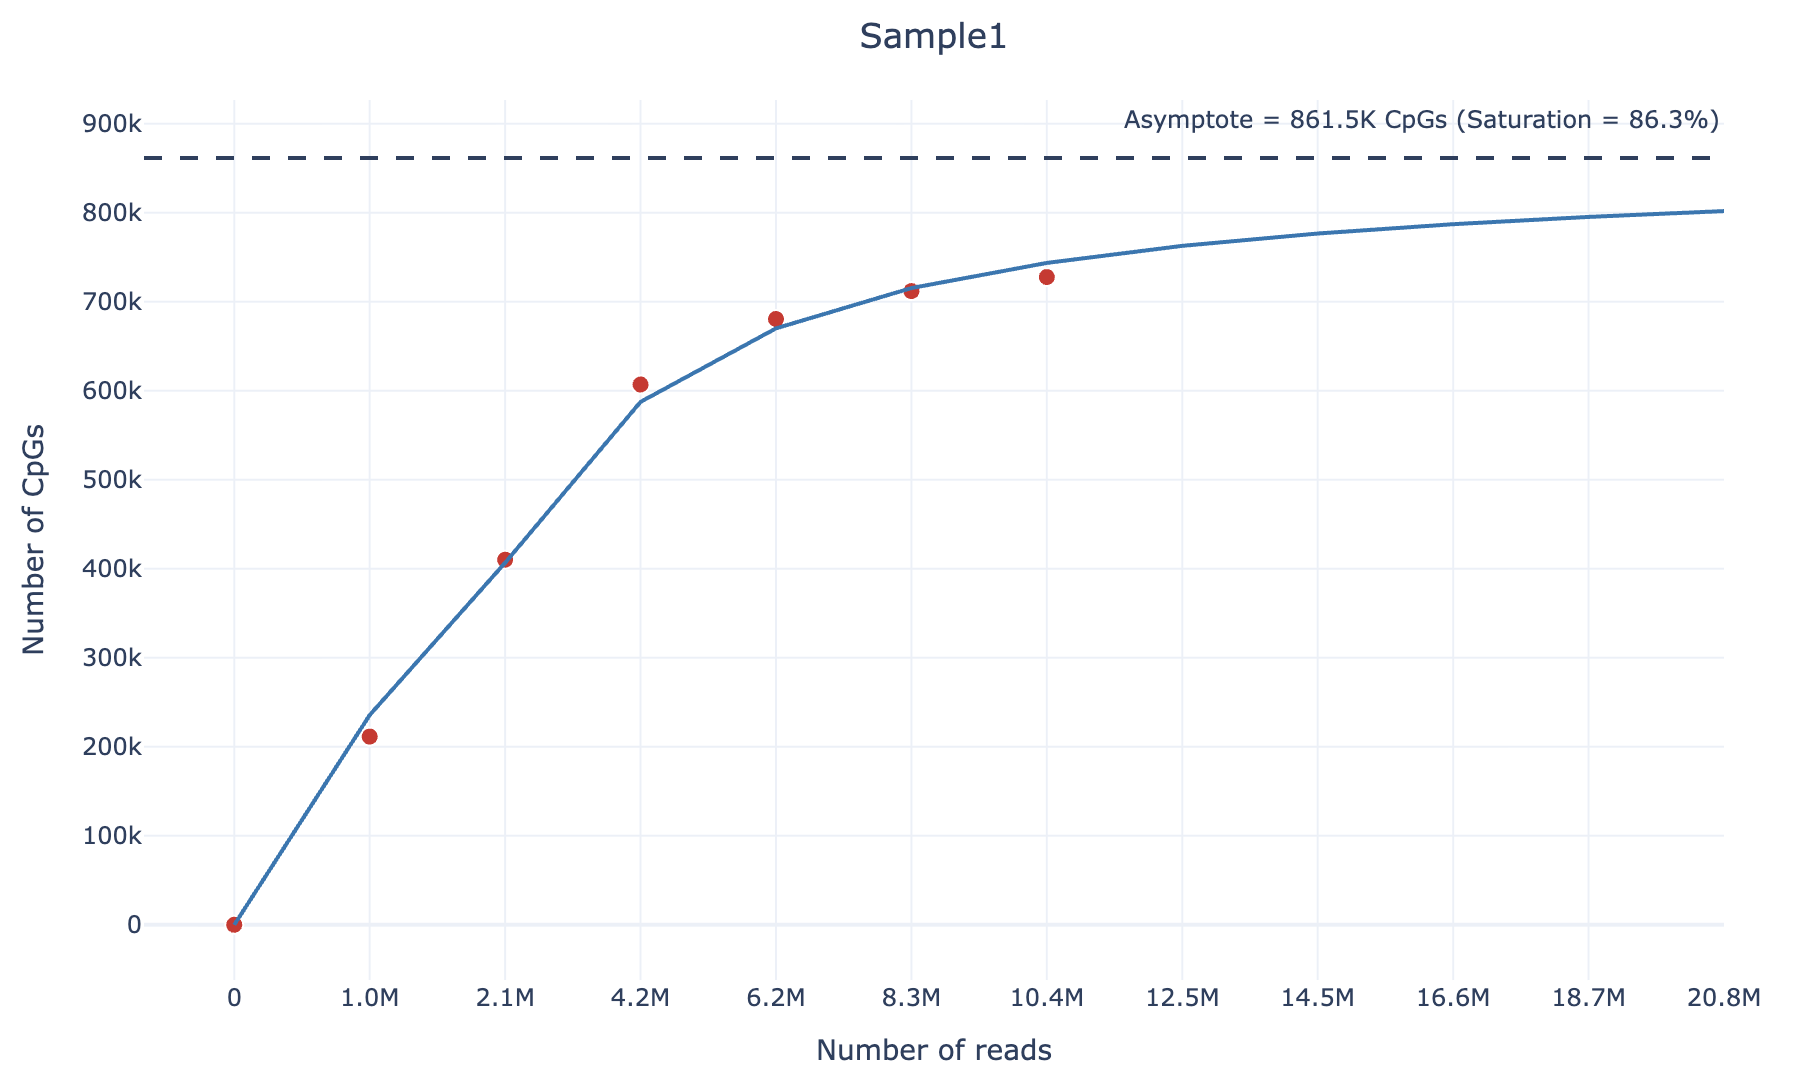
6. How do we compute the sequencing saturation?
To calculate the sequencing saturation of an RRBS sample, we adopt the following strategy. For each sample, we downsample it according to 4 different percentages (default: 0.1,0.2,0.4,0.6,0.8). Then, we compute the number of unique CpGs covered by at least 3 reads and the number of reads at each downsampling percentage.
We then fit the following curve using the scipy.optimize.curve_fit function:
We chose the arctangent function because it exhibits an asymptotic growth similar to sequencing saturation. For large values of $\text{x}$ (as $\text{x} \to \infty$), the asymptote corresponds to the theoretical maximum number of unique CpGs covered by at least 3 reads and can be computed as:
\[\text{asymptote} = \beta_0 \cdot \frac{\pi}{2}\]Finally, the sequencing saturation value can be calculated as following:
\[\text{Saturation} = \frac{\text{Number of unique CpGs (≥3 counts)}}{\text{Asymptote}}\]This approach allows estimation of the theoretical maximum number of CpGs that can be detected given an infinite sequencing depth, and quantifies how close the sample is to reaching sequencing saturation.